Figure 94=18
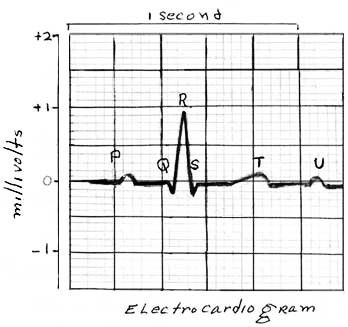
This is an illustration of one of the leads of an EKG showing the various patterns of depolarization of the cardiac conductive system (P, Q, R, S, T, U).
|
|
|
Figure 94=18 This is an illustration of one of the leads of an EKG showing the various patterns of depolarization of the cardiac conductive system (P, Q, R, S, T, U). |