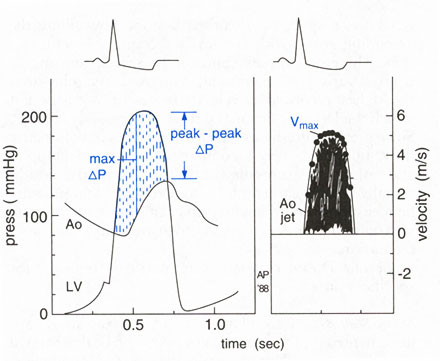
Figure 46d
Diagram illustrating the relation between
systolic pressure gradient and aortic velocity in valvular aortic stenosis.
Left: A dynamic systolic gradient between left ventricular and aortic
pressures is evident. Assuming proper alignment of the pressure tracings,
a series of instaneous pressure differences (dashed lines) can be measured,
and the mean systolic gradient can be calculated. The gradient between
the peak systolic left ventricular pressure and the systolic aortic
pressure can also be determined, even though these two peaks are nonsimultaneous.
Note that the maximum instantaneous gradient is always larger than the
peak-to-peak gradient. LV, left ventricular, Ao, aortic; max changeP,
maximum instantaneous gradient; peak-peak change P, peak left ventricular
to peak aortic gradient.
Right: Schematic continuous wave Doppler recording of aortic jet velocity
from above the valve (i.e., from the suprasternal or right parasternal
window). Using the simplified Bernoulli equation, instantaneous pressure
gradients can be determined from the instantaneous velocities and mean
gradient can be calculated. Maximum change P can be determined as 4(Vmax.)2.Ao
jet velocity.