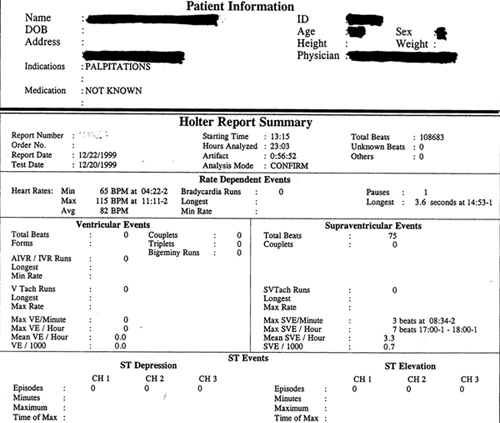
Figure 96a
Illustration of successive data of the 24 hour EKG Holter report page 1 (see definition for more information).